This walk-through is designed to illustrate common tasks and situations an application will perform when manipulating resources through the Mendeley API. The walk-through is based on the sample code Readership Locations, written in JavaScript.
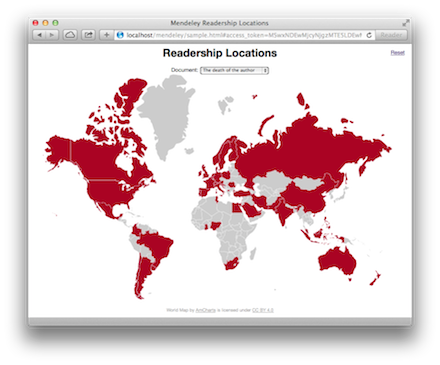
The Readership Locations sample application displays a world map showing the regions where a document has been read. The application lists the documents from a user library and for each document selected will request the catalog document using a Digital Object Identifier (DOI) value or an ArXiv value to link the catalog document to the document in the user's library.
The javascript application performs a number of tasks:
This walk-through will examine each of these tasks in detail and explain how the Mendeley API and the Mendeley Javascript SDK is used to accomplish each task.
Note: before running the example you should ensure you have a Mendeley account and your library contains a number of documents. Only documents with a DOI or ArXiv identifier will be displayed in the app. Use the tool Populator to insert appropriate sample documents into the user library.The HTML page, once loaded, executes the following JavaScript code
if (typeof window.oauthImplicitGrantConfig === 'object') {
MendeleySDK.API.setAuthFlow(MendeleySDK.Auth.implicitGrantFlow(window.oauthImplicitGrantConfig));
// ..
} else {
console.log("something is wrong");
}
The code uses the Mendeley SDK to retrieve and set the OAuth data. The authentication token has a limited lifespan so you will be able to use the page for a while before having to re-authorize the app.
Once the HTML page has loaded and you are authenticated, the Javascript function
getDocuments
is invoked by binding a ready
event to the page.
$(document).ready(getDocuments)
The getDocuments
function looks like this:
var getDocuments = function () {
MendeleySDK.API.documents
.list()
.done(populateDropdown)
.fail(errorHandler);
}
There is no need to do any kind of configuration.
The argument populateDropdown
passed to the done
method processes the
result
var populateDropdown = function (docs) {
var i, len, doc, identifierType, identifierValue,
popup_menu = document.getElementById("user_doc_popup");
for (i = 0, len = docs.length, doc; i < len; i+=1) {
doc = docs[i];
if (doc.identifiers) {
if (doc.identifiers.arxiv) {
identifierType = "arxiv";
identifierValue = doc.identifiers.arxiv;
}
if (doc.identifiers.doi) {
identifierType = "doi";
identifierValue = doc.identifiers.doi;
}
}
if (identifierType) {
var option = document.createElement("option");
option.textContent = doc.title;
option.setAttribute("data-identifier-type", identifierType);
option.value = identifierValue;
popup_menu.appendChild(option);
}
}
$("#user_doc_popup").trigger("change");
}
If the API response is successful, the JSON response text is used to populate the popup menu. The
function checks each object for the existence of a DOI or ArXiv identifier. If the document has at
least
one of these two identifiers, an <option>
element is appended to the popup menu.
The
document's title is used for the visible label and the identifier is stored in the hidden value of
the
HTML select element. The identifier type is also stored as a data attribute for later use.
Once the popup menu is composed, the function triggers a change
event to color code the
map
using the first item in the popup menu. Instantly providing gratification and indication of function
improve the user experience.
Whenever the user selects a new document, or immediately after the document popup menu is populated,
the reading statistics for the newly selected document are loaded with the help of the Javascript
SDK. The
reading statistics are used to color regions of the map. The JavaScript function
getCatalog
sends the API request and calls updateMap
to color maps regions
on
a successful response:
var getCatalog = function (event) {
var identifierType = this.selectedOptions.item(0).dataset.identifierType,
identifierValue = this.value,
uriArgs = {};
uriArgs[identifierType] = identifierValue;
uriArgs["view"] = "stats";
MendeleySDK.API.catalog
.search(uriArgs)
.done(updateMap)
.fail(errorHandler);
event.preventDefault();
}
First the function obtains the identifier type and value stored in the popup menu. Next the function
creates an array with this information and passes it as argument to the search
method.
To be more precise, the URL will contain the following settings:
view
field in the query string to stats
to include
reading statistics in the response
The updateMap
function looks like this:
var updateMap = function (stats) {
var arrayData = {},
maxCount = 0,
ratio;
$.each(stats, function(i, obj) {
if (obj.reader_count_by_country) {
for (var property in obj.reader_count_by_country) {
if(arrayData[property]) {
arrayData[property] += obj.reader_count_by_country[property];
} else {
arrayData[property] = obj.reader_count_by_country[property];
}
maxCount = Math.max(maxCount, arrayData[property]);
}
}
});
var map_regions = map.contentDocument.getElementsByClassName('land');
for (var index = 0; index < map_regions.length; index++) {
var map_region = map_regions[index].getAttribute("title");
if (arrayData[map_region]) {
ratio = arrayData[map_region]/maxCount;
map_regions[index].style.fill = "rgba(157, 22, 32, " + ratio + ")";
} else {
map_regions[index].style.fill = "rgb(204,204,204)";
}
}
}
If the API response is successful, an array containing the total number of readers by country is built using the data. This is an array with keys labelled with English descriptions of the country and the corresponding value is an integer indicating the number of times a document has been read.
After that, the function simply looks for matches between the region title
label in the
SVG
map and the country member label in the /catalog
API response:
** API response **
"reader_count_by_country": {
"Ireland": 2,
"United Kingdom": 1
}
** SVG document **
<path id="GB" title="United Kingdom" class="land" d="M459.38,281l-1.5,3.29l-2.12,-0.98l-1.73…" />
<path id="IE" title="Ireland" class="land" d="M457.88,284.29L458.34,287.65L456.22,291.77L451…" />
The function also calculates a ratio of readers distribution and uses an alpha value when coloring the map so that it reflects the relative number of readers
As geographic regions without reading statistics are not included, the function simply iterates through the map regions and if a reading statistic country is found, the function sets the map region's SVG fill color to red. If no country entry is found, the SVG map region is filled gray.
Now that you understand how the sample code works, explore further by enhancing the application with new features.
/catalog
document responses to avoid repeatedly
performing
identical API requests each time the user changes document in the popup menu. Perhaps use an
object
global variable to store reading statistics keyed to an identifier.